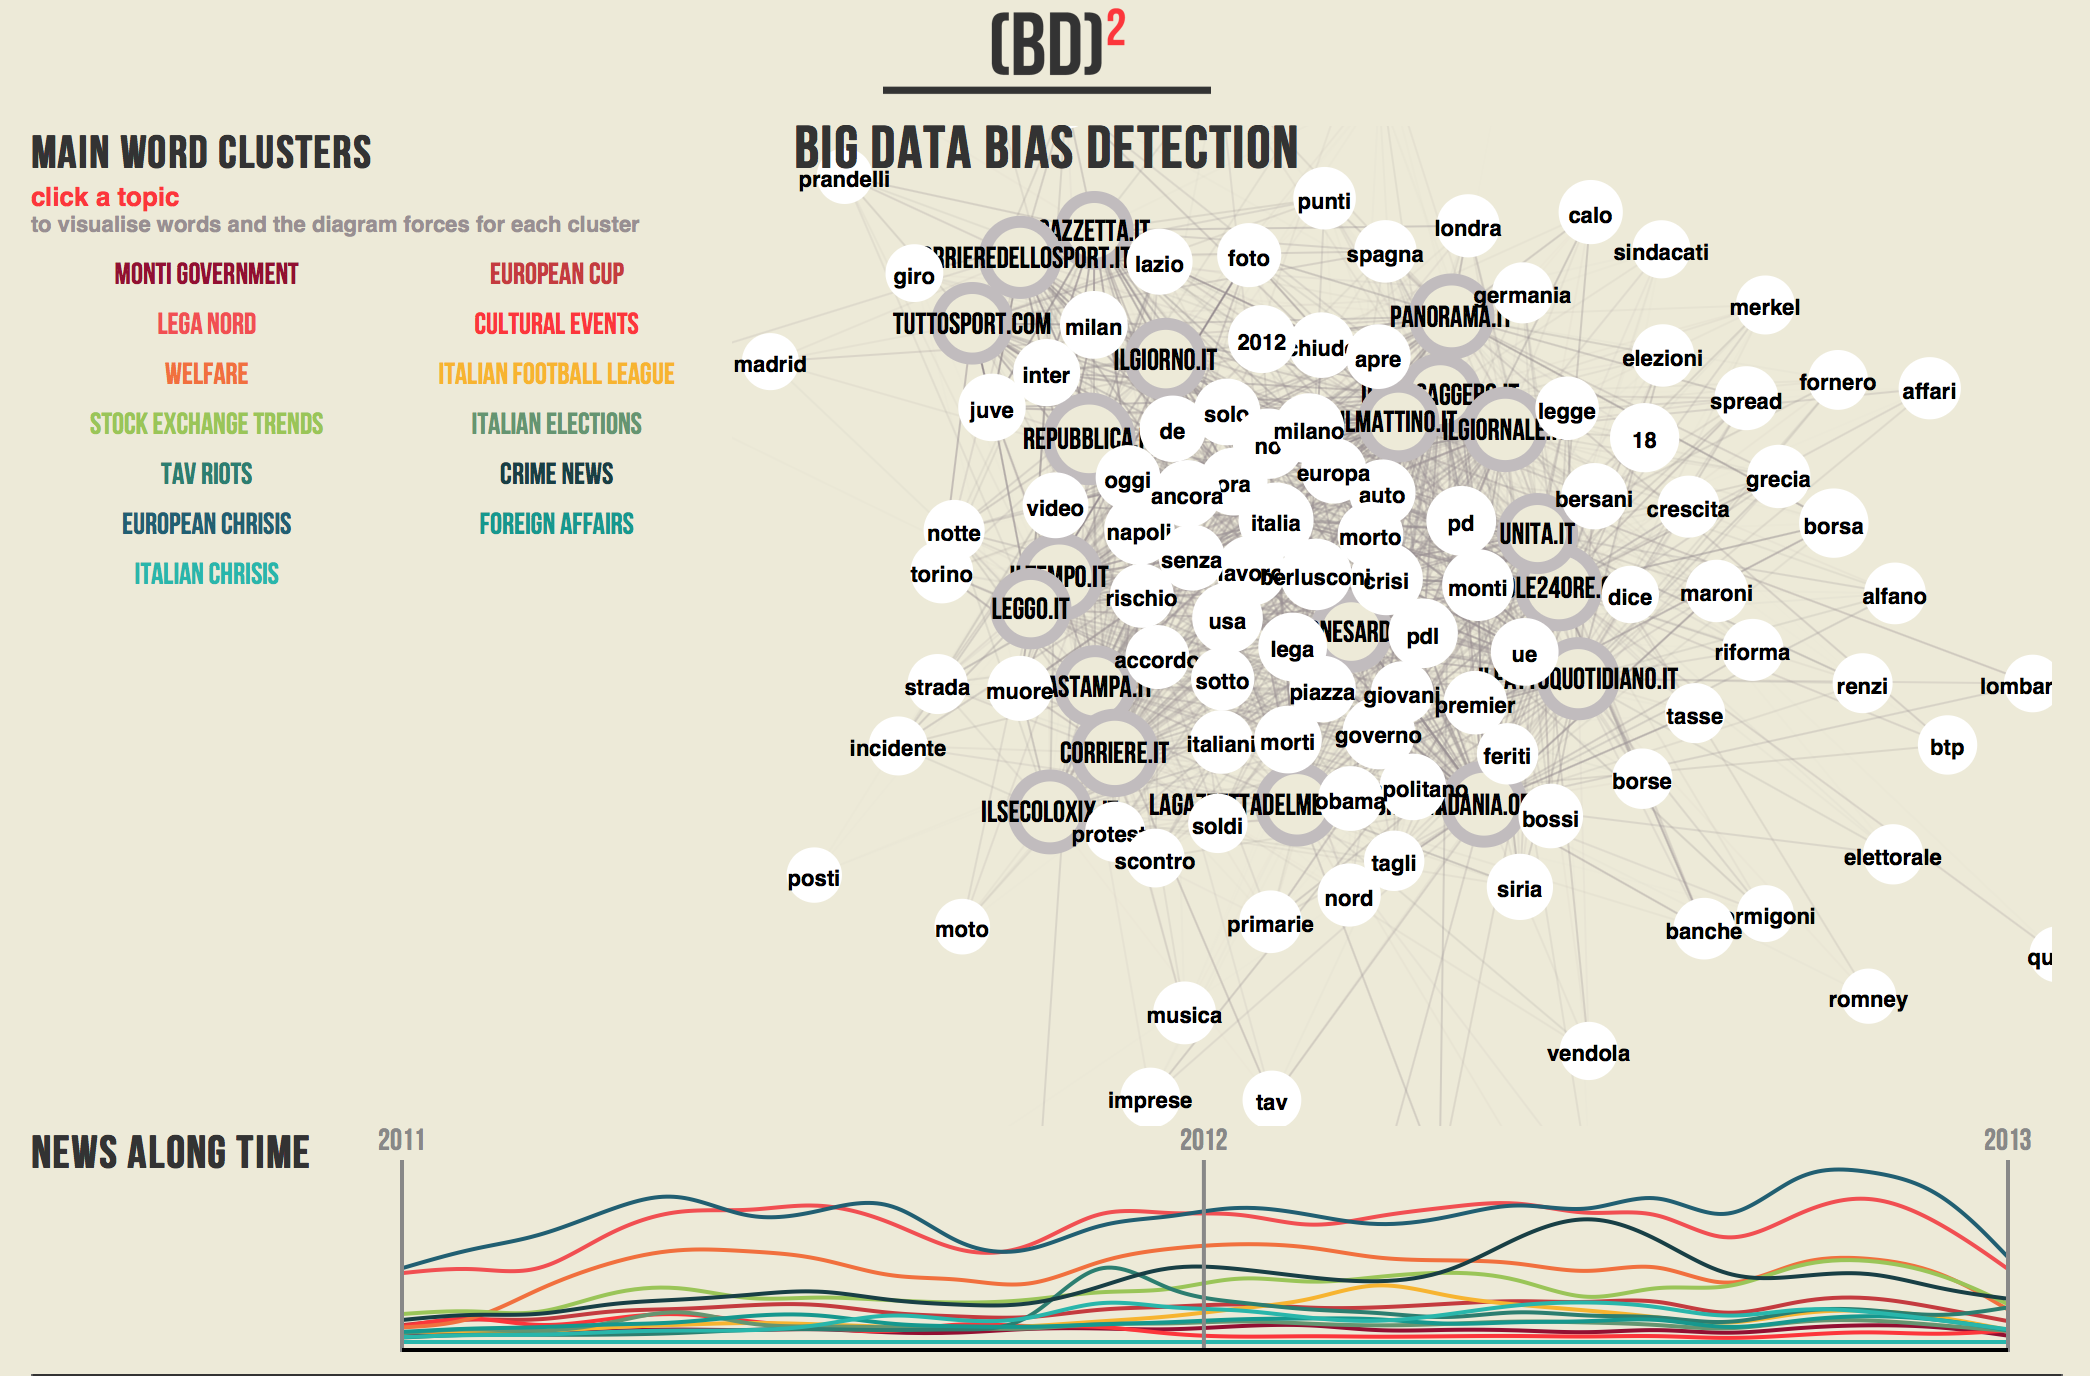
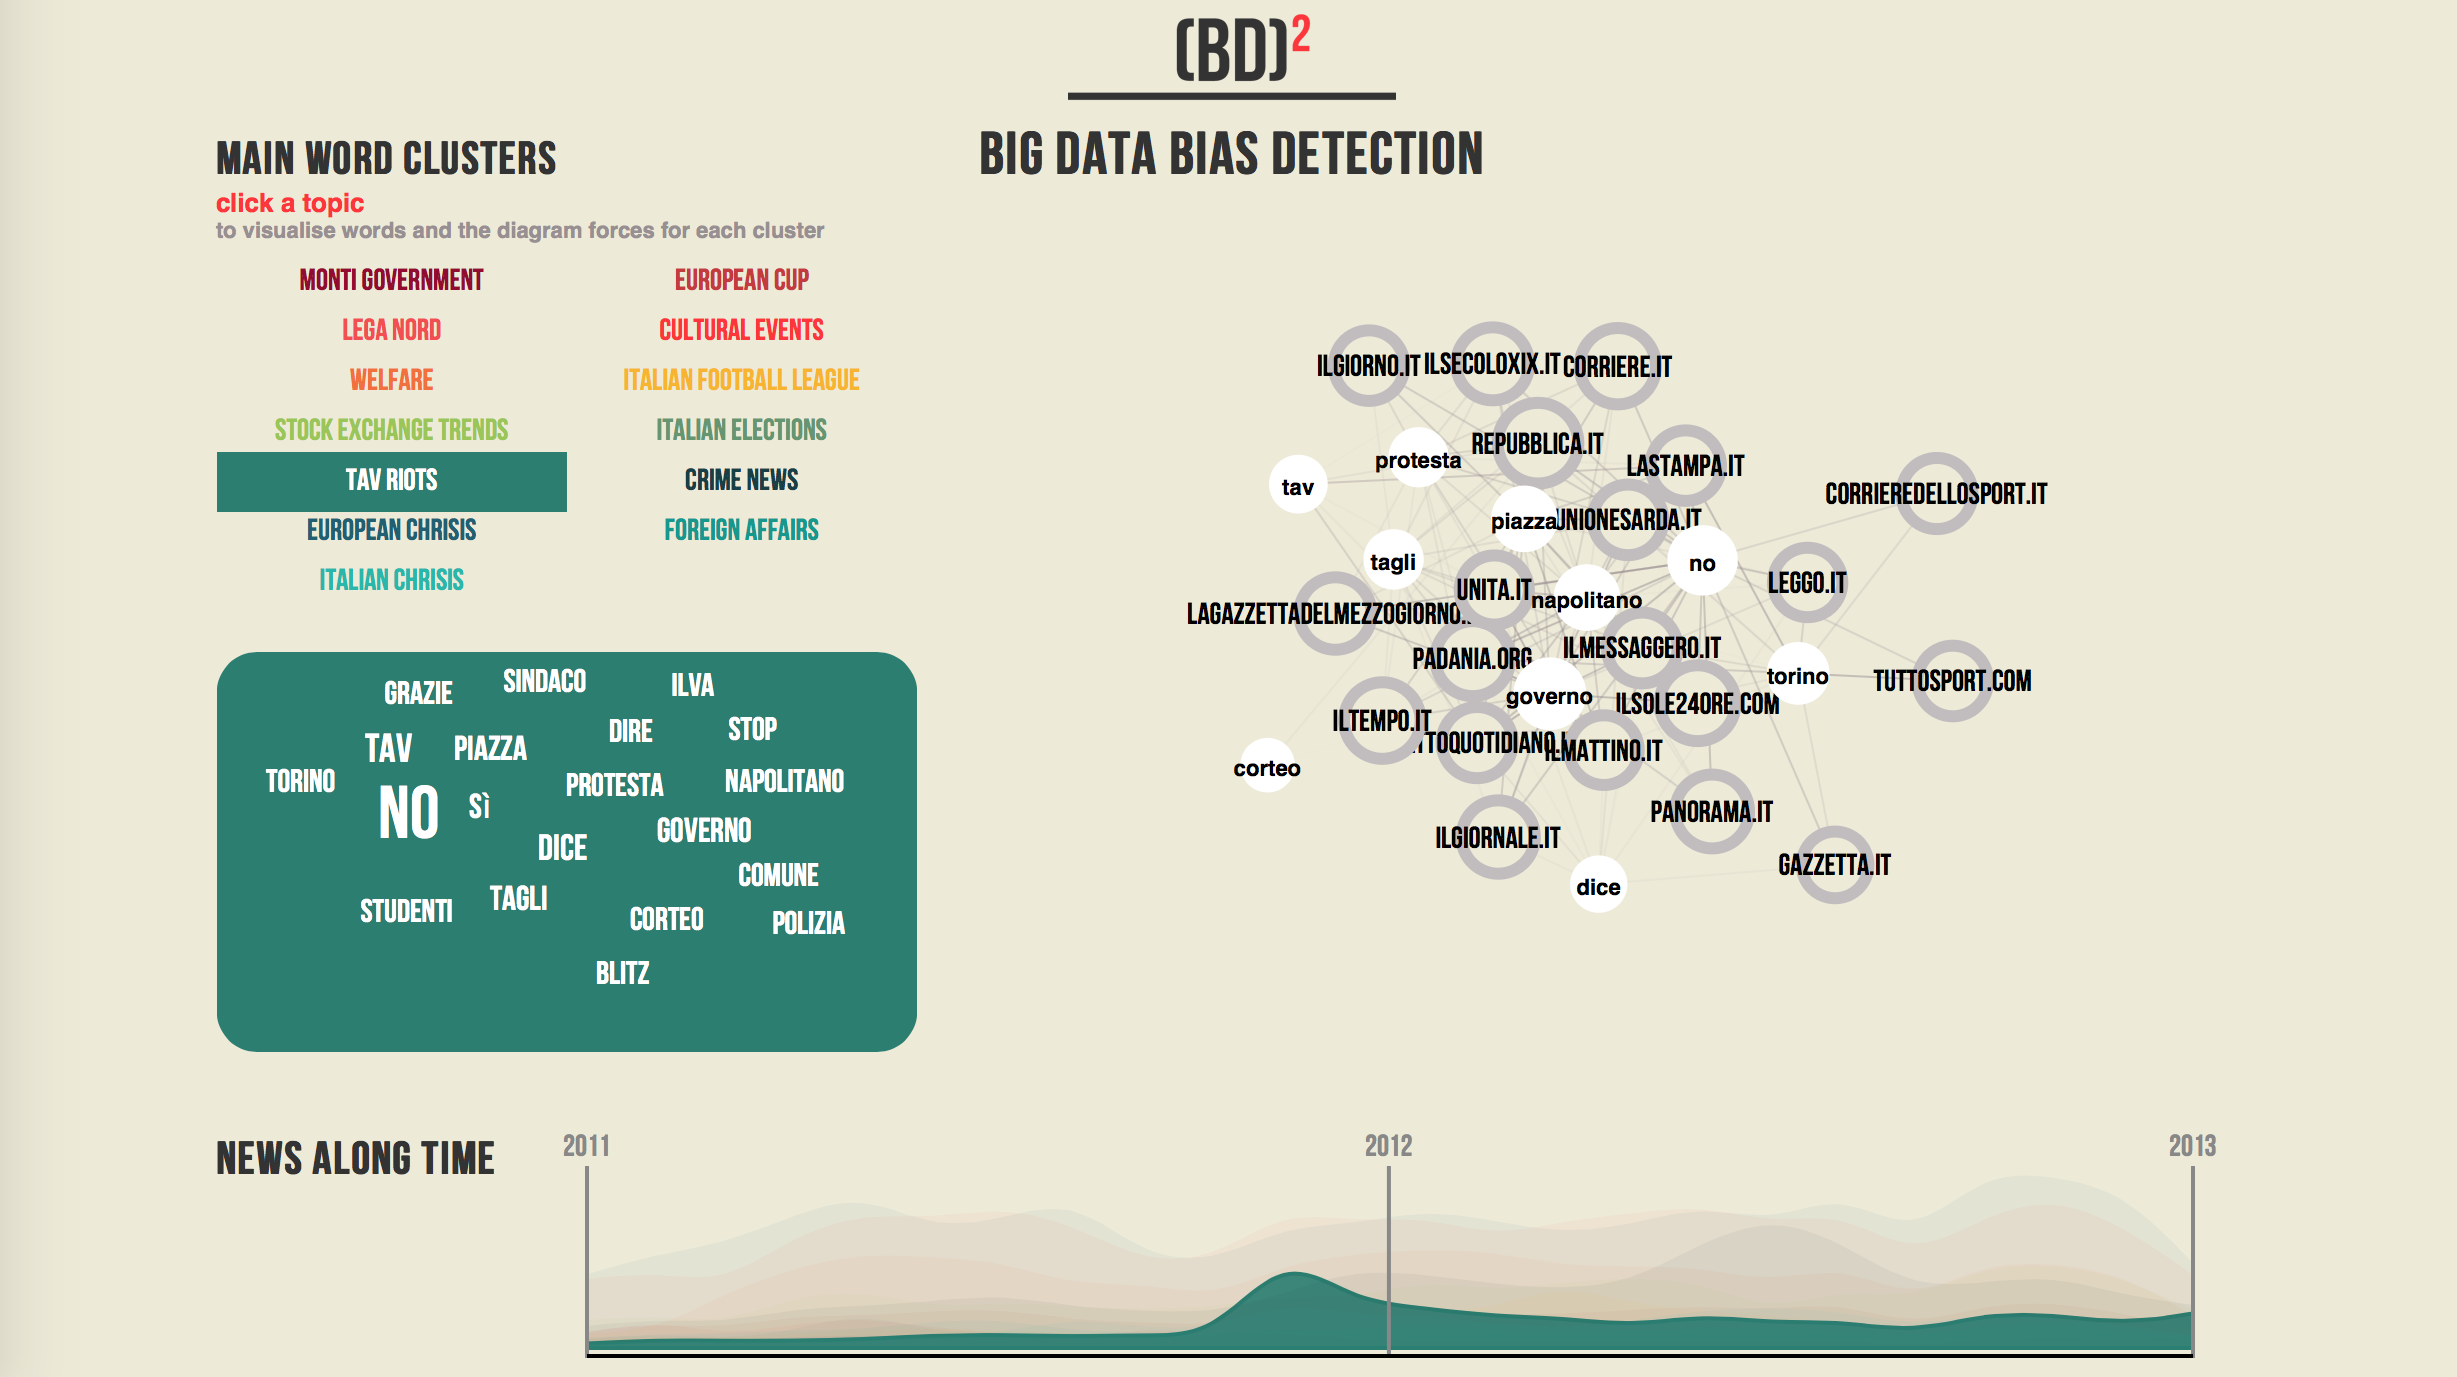
Shows the trends of topics over time and the correlation of newspapers and topical words to reveal their bias.
Topic modeling with NNMF (Python), batch analysis with Hadoop, visualization with d3.js (JavaScript).
Read the presentation.
Interactive visualization of 2 years of Italian newspaper feeds
Shows the trends of topics over time and the correlation of newspapers and topical words to reveal their bias.
Topic modeling with NNMF (Python), batch analysis with Hadoop, visualization with d3.js (JavaScript).
Read the presentation.
Collaborators
David Martin-Borregon
Erika Vicarietti
Francesco Corazza